Logo on the left: Signal Integrity
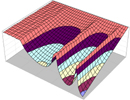
The logo on the left is an illustration from my signal-integrity
training classes. The Excel surface plot shows the transfer
function of a periodically loaded interconnect. The vertical
scale shows the transfer function in dB. Frequency is plotted
along the left axis logarithmically; high frequencies are in
the front, lower frequencies are towards the back. The right
axis shows the simulation nodes along the equidistantly spaced
periodical loads; source node is in the upper right, far-end
termination node is in the front center. The interconnect
segments in the Berkely SPICE simulations had 50-ohm characteristic
impedance. For sake of clarity, the periodical loads were
modeled with lossless capacitive reactances.
